[ Content | Sidebar ]

Archives for programming

Generating perf maps with OpenJDK 17

February 28th, 2021

Linux perf is a fantastically useful tool for all sorts of profiling tasks. It’s a statistical profiler that works by capturing the program counter value when a particular performance event occurs. This event is typically generated by a timer (e.g. 1kHz) but can be any event supported by your processor’s PMU (e.g. cache miss, branch mispredict, etc.). Try perf list to see the events available on your system.

A table of raw program counter addresses isn’t particularly useful to humans so perf needs to associate each address with the symbol (function) that contains it. For ahead-of-time compiled programs and shared libraries perf can look this up in the ELF symbol table on disk, but for JIT-compiled languages like Java this information isn’t available as the code is generated on-the-fly in memory.

Let’s look at what perf top reports while running a CPU-intensive Java program:

Samples: 136K of event 'cycles', 4000 Hz, Event count (approx.): 57070116973 lost: 0/0 drop: 0/0
Overhead  Shared Object                       Symbol
  16.33%  [JIT] tid 41266                     [.] 0x00007fd733e40ec0
  16.15%  [JIT] tid 41266                     [.] 0x00007fd733e40e3b
  16.14%  [JIT] tid 41266                     [.] 0x00007fd733e40df1
  16.14%  [JIT] tid 41266                     [.] 0x00007fd733e40e81
   2.80%  [JIT] tid 41266                     [.] 0x00007fd733e40df5
   2.62%  [JIT] tid 41266                     [.] 0x00007fd733e40e41
   2.45%  [JIT] tid 41266                     [.] 0x00007fd733e40ec4
   2.43%  [JIT] tid 41266                     [.] 0x00007fd733e40e87

Perf marks these locations as [JIT] because the addresses are in part of the process’s address map not backed by a file. Because the addresses are all very similar we might guess they’re in the same method, but perf has no way to group them and shows each unique address separately. Apart from that it’s not very helpful for figuring out which method is consuming all the cycles.

As an aside, it’s worth briefly comparing perf’s approach, which samples the exact hardware instruction being executed when a PMU event occurs, with a traditional Java profiler like VisualVM which samples at the JVM level (i.e. bytecodes). A JVM profiler needs to interrupt the thread, then record the current method, bytecode index, and stack trace, and finally resume the thread. Obviously this has larger overhead but there is a deeper problem: JIT-ed code cannot be interrupted at arbitrary points because the runtime may not be able to accurately reconstruct the VM state at that point. For example one cannot inspect the VM state halfway through executing a bytecode. So at the very least the JIT-ed code needs to continue executing to the end of the current bytecode. But requiring the VM to be in a consistent state at the end of each bytecode places too many restrictions on an optimising JIT. Therefore the optimised code can typically only be interrupted at special “safepoints” inserted by the JIT – in Hotspot this is at method return and loop back-edges. That means that a JVM profiler can only see the thread stopped at one of these safepoints which may deviate from the actual hot parts of the code, sometimes wildly. This problem is known as safepoint bias.

So a hardware profiler can give us better accuracy, but how to translate the JIT-ed code addresses to Java method names? Currently there are at least two tools to do this, both of which are implemented as JVMTI plugins that load into a JVM process and then dump some metadata for perf to use.

The first is the “jitdump” plugin that is part of the Linux perf tree. After being loaded into a JVM, the plugin writes out all the machine code and metadata for each method that is JIT compiled. Later this file can be combined with recorded profile data using perf inject --jit to produce an annotated data file with the correct symbol names, as well as a separate ELF shared object for each method allowing perf to display the assembly code. I use this often at work when I need to do some detailed JIT profiling, but the offline annotation step is cumbersome and the data files can be 100s of MB for large programs. The plugin itself is complex and historically buggy. I’ve fixed several of those issues myself but wouldn’t be surprised if there are more lurking. This tool is mostly overkill for typical Java developers.

The second tool that I’m aware of is perf-map-agent. This generates a perf “map” file which is a simple text file listing start address, length, and symbol name for each JIT compiled method. Perf will load this file automatically if it finds one in /tmp. As the map file doesn’t contain the actual instructions it’s much smaller than the jitdump file, and doesn’t require an extra step to annotate the profile data so it can be used for live profiling (i.e. perf top). The downsides are that profile data is aggregated by method so you can’t drill down to individual machine instructions, and the map can become stale with a long-running VM as methods can be unloaded or recompiled. You also need to compile the plugin yourself as it’s not packaged in any distro and many people would rightly be wary of loading untrusted third-party code which has full access to the VM. So it would be much more convenient if the VM could just write this map file itself.

OpenJDK 17, which should be released early next month, has a minor new feature contributed by yours truly to do just this: either send the diagnostic command Compiler.perfmap to a running VM with jcmd, or run java with -XX:+DumpPerfMapAtExit, and the VM will write a perf map file that can be used to symbolise JIT-ed code.

$ jps
40885 Jps
40846 PiCalculator
$ jcmd 40846 Compiler.perfmap
40846:
Command executed successfully
$ head /tmp/perf-40846.map 
0x00007ff6dbe401a0 0x0000000000000238 void java.util.Arrays.fill(int[], int)
0x00007ff6dbe406a0 0x0000000000000338 void PiSpigout.calc()
0x00007ff6dbe40cc0 0x0000000000000468 void PiSpigout.calc()
0x00007ff6dbe41520 0x0000000000000138 int PiSpigout.invalidDigitsControl(int, int)
0x00007ff6d49091a0 0x0000000000000110 void java.lang.Object.<init>()
0x00007ff6d4909560 0x0000000000000350 int java.lang.String.hashCode()
0x00007ff6d4909b20 0x0000000000000130 byte java.lang.String.coder()
0x00007ff6d4909ea0 0x0000000000000170 boolean java.lang.String.isLatin1()

Here we can see for example that the String.hashCode() method starts at address 0x00007ff6d4909560 and is 0x350 bytes long. Let’s run perf top again:

Samples: 206K of event 'cycles', 4000 Hz, Event count (approx.): 94449755711 lost: 0/0 drop: 0/0
Overhead  Shared Object                         Symbol
  78.78%  [JIT] tid 40846                       [.] void PiSpigout.calc()
   0.56%  libicuuc.so.67.1                      [.] icu_67::RuleBasedBreakIterator::handleNext
   0.34%  ld-2.31.so                            [.] do_lookup_x
   0.30%  libglib-2.0.so.0.6600.3               [.] g_source_ref
   0.24%  libglib-2.0.so.0.6600.3               [.] g_hash_table_lookup
   0.24%  libc-2.31.so                          [.] __memmove_avx_unaligned_erms
   0.20%  libicuuc.so.67.1                      [.] umtx_lock_67

This is much better: now we can see that 79% of system-wide cycles are spent in one Java method PiSpigout.calc().

Alternatively we can do offline profiling with perf record:

$ perf record java -XX:+UnlockDiagnosticVMOptions -XX:+DumpPerfMapAtExit PiCalculator 50
3.1415926535897932384626433832795028841971693993750
[ perf record: Woken up 1 times to write data ]
[ perf record: Captured and wrote 0.030 MB perf.data (230 samples) ]
$ perf report
Samples: 340  of event 'cycles', Event count (approx.): 71930116
Overhead  Command          Shared Object       Symbol
  11.83%  java             [JIT] tid 44300     [.] Interpreter
   4.19%  java             [JIT] tid 44300     [.] flush_icache_stub
   3.87%  java             [kernel.kallsyms]   [k] mem_cgroup_from_task
...

Here the program didn’t run long enough for any method to be JIT compiled and we see most of the cycles are spent in the interpreter. (By the way, the interpreter still looks like JIT-ed code to perf because its machine code is generated dynamically by Hotspot at startup.)

I’d be interested to hear from anyone who tries this new feature and finds it useful, or otherwise!
Emacs: enable whitespace-mode automatically in files with tabs

January 28th, 2021

I normally only use spaces to indent but sometimes I have to edit a file that contains tabs and I don’t want to break the existing indentation. In this situation Emacs’ whitespace-mode is very useful for showing exactly which whitespace characters are present in a file. But I don’t want to enable it all the time so I use this little function to check automatically if a file contains tabs, and if so enable whitespace-mode and also indent-tabs-mode so that any new lines are indented with tabs as well.

(defun check-for-tabs ()
  "Enable whitespace-mode and indent-tabs-mode if the buffer
contains tabs."
  (when (save-excursion
          (goto-char (point-min))
          (search-forward "\t" nil t))
    (whitespace-mode +1)
    (setq-local indent-tabs-mode t)))
 
(add-hook 'find-file-hook #'check-for-tabs)

Changing Emacs C align function to only apply once per line

January 3rd, 2021

I find myself using M-x align a lot in Emacs to line up the identifiers in blocks of C declarations or statements like the following:

struct foo {
   something x;
   int hello;
   long *blodgett;
};
 
int *q;
bazbazbaz *y;
static char fnork;
 
spoonful = sugar;
spork = 1;

After marking the region containing the declarations a quick M-x align transforms it into:

struct foo {
   something  x;
   int        hello;
   long      *blodgett;
};
 
int         *q;
bazbazbaz   *y;
static char  fnork;
 
spoonful = sugar;
spork    = 1;

Which looks much neater to my eyes. However when the declarations have initialisers the result is not at all pleasing:

int x = 5;
struct baz baz = { 1, 2 };
const int *this_is_a_pointer = NULL;

Becomes

int         x                 = 5;
struct baz  baz               = { 1, 2 };
const int  *this_is_a_pointer = NULL;

Really I only want it to align the identifiers and leave the = where they were. I’m sure I can’t be the only one with this problem but I’ve no idea what to type into Google or Stack Overflow to find the solution, and the manual doesn’t help either.

My current solution is to patch the list of alignment rules in align-rules-list with this bit of hackery:

;;; Define this in a file with `lexical-binding' set or else change the
;;; `let' below to `lexical-let'.
(defun nick-fix-c-align ()
  (let ((var-decl-regexp (alist-get 'regexp
                                    (alist-get 'c-variable-declaration
                                               align-rules-list))))
    (push `(valid . ,(lambda ()
                       (not (save-excursion
                              (end-of-line)
                              (looking-back var-decl-regexp)))))
          (alist-get 'c-assignment align-rules-list))))

The variable align-rules-list holds a list of rules for patterns like “C assignment”, “C variable declaration”, and so on. Each rule is an alist with a regex trigger, a list of modes to enable it in, an optional predicate valid to further restrict when it is run, and some other irrelevant options. The align function loops over this list and aligns any text where the regex matches and valid returns true.

The problem is C declarations with intialisers trigger both the c-variable-declaration and the c-assignment rules. There’s no way to tell it “stop processing rules if this matches” so the function above modifies the rules list to add an extra predicate to the c-assignment rule which says “do not apply this rule when the line also matches the regex for C variable declarations”.

align-load-hook is called after align.el has been loaded, which is a convienent time to patch the rules list. Afterwards M-x align lines up only the identifiers in declarations:

int         x = 5;
struct baz  baz = { 1, 2 };
const int  *this_is_a_pointer = NULL;

SIGPIPE and how to ignore it

September 23rd, 2020

I recently found myself trying to port a program that uses Boost Asio to run on OpenBSD. Everything compiled OK but while running it would occasionally exit with an unhandled SIGPIPE signal. This doesn’t happen on Linux. What’s going on here?

SIGPIPE is a synchronous signal that’s sent to a process (thread in POSIX.1-2004) which attempts to write data to a socket or pipe that has been closed by the reading end. Importantly it’s not an asynchronous signal that notifies you when the reading end has been closed: it’s delivered only when you attempt to write data. In fact it’s generated precisely when the system call (write(2), sendmsg(2), etc.) would fail with EPIPE and doesn’t give any additional information.

So what’s the point then? The default action for SIGPIPE is to terminate the process without a core dump (just like SIGINT or SIGTERM). This simplifies error handling in programs that are meant to run as part of a shell pipeline: reading input, transforming it, and then writing it to another process. SIGPIPE allows the program to skip error handling and blindly write data until it’s killed.

For programs that handle write errors it doesn’t seem to be useful and is best avoided. But unfortunately there are several different ways to do that.

Ignore the signal globally

This is the easiest if you are in complete control of the program (i.e. not writing a library). Just set the signal to SIG_IGN and forget about it.

signal(SIGPIPE, SIG_IGN);

Use MSG_NOSIGNAL

If you are writing to a socket, and not an actual pipe, pass the MSG_NOSIGNAL flag to send(2) or sendmsg(2). This has been in Linux for ages and was standardised in POSIX.1-2008 so it’s available almost anywhere.

Set SO_NOSIGPIPE socket option

This is a bit niche as it only exists on FreeBSD and OS X. Use setsockopt(2) to set this option on a socket and all subsequent send(2) calls will behave as if MSG_NOSIGNAL was set.

int on = 1;
setsockopt(s, SOL_SOCKET, SO_NOSIGPIPE, &on, sizeof(on))

This seems to be of limited utility as calling write(2) on the socket will still generate SIGPIPE. The only use I can think of is if you need to pass the socket to a library or some other code you don’t control.

Temporarily mask the signal on the current thread

The most general solution, for when you are not in full control of the program’s signal handling and want to write data to an actual pipe or use write(2) on a socket, is to first mask the signal for the current thread with pthread_sigmask(3), write the data, drain any pending signal with sigtimedwait(2) and a zero timeout, and then finally unmask SIGPIPE. This technique is described in more detail here. Note that some systems such as OpenBSD do not have sigtimedwait(2) in which case you need to use sigpending(2) to check for pending signals and then call the blocking sigwait(2).

Anyway back to the original problem. Asio hides SIGPIPE from the programmer by either setting the SO_NOSIGPIPE socket option on systems that support it, or on Linux by passing MSG_NOSIGNAL to sendmsg(2). None of these apply to OpenBSD which is why we get the SIGPIPE. I submitted a pull request to pass MSG_NOSIGNAL on OpenBSD as well. But I don’t know when or if that will be merged so I’m also trying to get the same fix added to the ports tree.

UPDATE: a patch is now in the ports tree.

Making Emacs GUD Usable

June 9th, 2019

Emacs provides a wrapper for various debuggers including GDB called the Grand Unified Debugger (GUD). I’ve tried it in the past but always run into lots of minor annoyances with the UI so I just use command line GDB instead. But recently I’ve being trying to adopt a more “Emacs native” workflow, including using EShell instead of a separate terminal window for Bash, Magit instead of command line git, ERC for IRC, etc. So let’s see if we can fix these GUD problems…

Basic configuration

(setq gdb-many-windows t
      gdb-use-separate-io-buffer t)

The default mode of GUD just creates a single window with the the normal GDB terminal. This doesn’t seem to offer much over running GDB directly. The “many windows” mode splits the screen into six separate windows showing the current source file, locals/registers, output, etc.

Source file opens in the wrong window

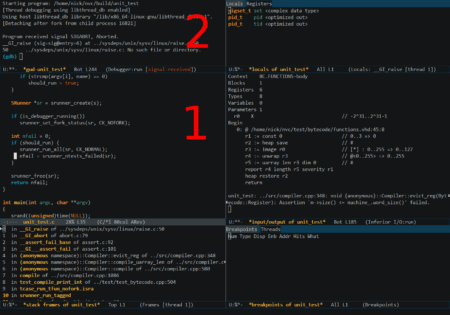
By default if you jump to a source file from e.g. the stack trace window it will open on top of the command input window (labeled “2” below) rather than the source file window “1”.

This seems to be “normal” behaviour, and there are loads of threads on Stack Overflow complaining about it but with no conclusive solution. E.g. see here or here.

The problem here is that GUD makes all the popup windows “dedicated” except for the command window. When you jump to a file it opens in the first non-dedicated window, which sort-of makes sense. The function that sets up the windows is called gdb-setup-windows so we can use Emacs’ “advice” system to hook this function and run some extra code afterwards to make the command window dedicated:

(advice-add 'gdb-setup-windows :after
            (lambda () (set-window-dedicated-p (selected-window) t)))

This works because gdb-setup-windows always leaves the command window selected when it finishes.

Quitting messes up the window configuration

How do you quit anyway? I think the correct way is just to run quit in the command window. But no matter how you quit GUD always messes up whatever window configuration you had before you opened it.

We can fix that by saving the window layout when we run M-x gdb by storing the layout into a register in gud-mode-hook. The gud-sentinal function runs when some event occurs on the inferior gdb process. We can hook that to restore the window state when the process exits.

(defconst gud-window-register 123456)
 
(defun gud-quit ()
  (interactive)
  (gud-basic-call "quit"))
 
(add-hook 'gud-mode-hook
          (lambda ()
            (gud-tooltip-mode)
            (window-configuration-to-register gud-window-register)
            (local-set-key (kbd "C-q") 'gud-quit)))
 
(advice-add 'gud-sentinel :after
            (lambda (proc msg)
              (when (memq (process-status proc) '(signal exit))
                (jump-to-register gud-window-register)
                (bury-buffer))))

I’ve bound C-q to gud-quit which send the quit command to GDB to save typing.

Using ORC with LLVM’s C API

May 11th, 2017

I recently updated the JIT back-end of my VHDL simulator to use LLVM’s new ORC API which was added in version 3.9. It has a couple of advantages, the two important ones for me were re-introduction of lazy-JIT-ing of functions, and that it works on Windows. Both features that were lost moving from the legacy JIT API to the newer MCJIT one. ORC is actually built as a layer on top of MCJIT though.

Documentation seems to be pretty scarce. There’s some example code but it all uses the C++ API so I thought it might be useful to write some notes on how I use it with the C API. You simply need to include this header and then either link against the LLVM shared library or llvm-config --libs orcjit.

#include <llvm-c/OrcBindings.h>

Initialise the LLVM libraries and MCJIT back-end which ORC is built on:

LLVMInitializeNativeTarget();
LLVMInitializeNativeAsmPrinter();
LLVMLinkInMCJIT();

Let’s assume you already have an LLVM bitcode module from somewhere else:

LLVMModuleRef module = ...;

Unlike the MCJIT API and the original LLVM JIT API you need a “target machine” reference to create the ORC object. This is probably the only non-obvious part but a bit of searching in the other headers finds some functions to do it:

char *def_triple = LLVMGetDefaultTargetTriple();   // E.g. "x86_64-linux-gnu"
char *error;
LLVMTargetRef target_ref;
if (LLVMGetTargetFromTriple(def_triple, &target_ref, &error)) {
   // Fatal error
}
 
if (!LLVMTargetHasJIT(target_ref)) {
   // Fatal error, cannot do JIT on this platform
}
 
LLVMTargetMachineRef tm_ref =
   LLVMCreateTargetMachine(target_ref, def_triple, "", "",
                           LLVMCodeGenLevelDefault,
                           LLVMRelocDefault,
                           LLVMCodeModelJITDefault);
assert(tm_ref);
LLVMDisposeMessage(def_triple);

The two empty string arguments to LLVMCreateTargetMachine are CPU and Features. I can’t work out what these are used for and everything works fine if you pass an empty string. On LLVM 4.0 you can pass NULL here but this crashes on 3.9.

I haven’t experimented with anything other the default relocation model, which seems to work everywhere I tried it, or the optimisation level.

Now we can actually create the ORC object:

LLVMOrcJITStackRef orc_ref = LLVMOrcCreateInstance(tm_ref);
LLVMOrcAddLazilyCompiledIR(orc_ref, module, orc_sym_resolver, NULL);

The only interesting argument is orc_sym_resolver. This is a pointer to callback ORC will use when it needs you to resolve a symbol.

static uint64_t orc_sym_resolver(const char *name, void *ctx)
{
   return (uint64_t)(uintptr_t)LLVMOrcGetSymbolAddress(orc_ref, name);
}

The function LLVMOrcGetSymbolAddress seems to do exactly what we want, but you could do some custom symbol lookup if required.

You can also use this function to trigger the lazy compilation and get a function pointer to the result. For example:

int (*main_fn)(void) = LLVMOrcGetSymbolAddress(orc_ref, "main");
int result = (*main_fn)();

Writes Your Makefiles For You

December 31st, 2013

I’ve been dogfooding my VHDL compiler for a project at work and now that it’s gotten to the point where it can simulate non-trivial designs, compile times are becoming significant. Especially when files use Xilinx primitives as the vcomponents library takes a while to load.

At the moment I’m re-analysing every source file for each change I make, so obviously an improvement would be to write a makefile and only re-analyse the files that have changed and those that depend on them (e.g. an architecture must be re-analysed if the corresponding entity changed). But figuring out and maintaining the dependencies by hand is tedious and error prone so I’ve written a makefile generator that recursively finds the dependencies for previously analysed or elaborated units in a library. Invoke it like this:

nvc --make my_top_level >Makefile

Then running make will do the minimum amount of work to rebuild all the out of date files. If the argument to --make is an elaborated design then two convenience targets run and wave will be added to run the simulation and run with waveform output respectively.

The code is fairly compact: only 400 or so lines of C.

This also turned out to be handy for solving a long-standing problem of not being able to bootstrap the standard and IEEE libraries with parallel make (make -j). Previously the dependencies in the automake input file were incomplete, but now these are generated automatically by a gen-deps target. The output (e.g. here) is then mangled with sed and committed into the git repository (this solves a chicken-and-egg problem where the gen-deps target can only be run in an already built tree).

Improved Waveform Output

October 27th, 2013

I’ve spent a lot of time recently improving the waveform output of my VHDL compiler / simulator. Previously only the simple VCD format was supported: this only allows Verilog-style 4-value logic types to be dumped so doesn’t map very well onto VHDL types. The implementation was also very inefficient resulting in a 3-4x slowdown in simulation speed.

After experimenting with LXT for a while, NVC now uses GtkWave’s FST format by default. With some help from GtkWave’s author it can now dump full 9-value logic as well as most common VHDL types (enumerations, strings, integers, etc.).

I’ve put some work into improving the performance of waveform output and now dumping every signal to a FST incurs around 30% overhead. The VCD dumper has also been rewritten giving around 90% overhead. This format should generally be avoided unless you do not have access to GtkWave.

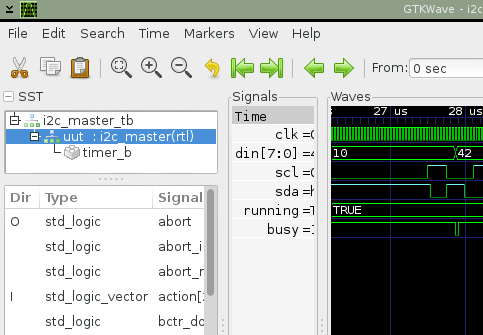
The screen shot below shows some of the new features:

gtkwave

Automagic Debugging

July 8th, 2012

It’s kind of annoying to have to go back and run GDB after your program crashes. Here’s a signal handler I’ve been using which drops you into GDB straight away:

static void gdb_sighandler(int sig, siginfo_t *info)
{
   char exe[256];
   if (readlink("/proc/self/exe", exe, sizeof(exe)) < 0) {
      perror("readlink");
      exit(EXIT_FAILURE);
   }
 
   char pid[16];
   snprintf(pid, sizeof(pid), "%d", getpid());
 
   pid_t p = fork();
   if (p == 0) {
      execl("/usr/bin/gdb", "gdb", "-ex", "cont", 
            exe, pid, NULL);
      perror("execl");
      exit(EXIT_FAILURE);
   }
   else if (p < 0) {
      perror("fork");
      exit(EXIT_FAILURE);
   }
   else {
      // Allow a little time for GDB to start before 
      // dropping into the default signal handler
      sleep(1);
      signal(sig, SIG_DFL);
   }
}

This probably breaks all sorts of rules on what you shouldn’t do in a signal handler but hey, it was going to crash anyway. Resetting the handler to SIG_DFL at the end is important or you’ll end up stuck in a loop when you try to quit GDB. Install it for all the unpleasant signals like this:

struct sigaction sa;
sa.sa_sigaction = (void*)gdb_sighandler;
sigemptyset(&sa.sa_mask);
sa.sa_flags = SA_RESTART | SA_SIGINFO;
 
sigaction(SIGSEGV, &sa, NULL);
sigaction(SIGUSR1, &sa, NULL);
sigaction(SIGFPE, &sa, NULL);
sigaction(SIGBUS, &sa, NULL);
sigaction(SIGILL, &sa, NULL);
sigaction(SIGABRT, &sa, NULL);

It’s probably worth checking whether GDB is already running before you do this. On Linux you can check this by trying to ptrace yourself: if it succeeds then a debugger isn’t attached.

static int is_debugger_running(void)
{
   pid_t pid = fork();
   if (pid == -1) {
      perror("fork");
      exit(EXIT_FAILURE);
   }
   else if (pid == 0) {
      int ppid = getppid();
      if (ptrace(PTRACE_ATTACH, ppid, NULL, NULL) == 0) {
         waitpid(ppid, NULL, 0);
         ptrace(PTRACE_CONT, NULL, NULL);
         ptrace(PTRACE_DETACH, getppid(), NULL, NULL);
         exit(0);
      }
      else
         exit(1);
   }
   else {
      int status;
      waitpid(pid, &status, 0);
      return WEXITSTATUS(status);
   }
}

Portable high resolution timestamps from stat

April 21st, 2012

A small nugget of information that might be useful to someone:

The standard timestamps in struct stat have type time_t which only gives a resolution of seconds which is less than required in many situations. Luckily most operating systems provide a higher resolution timestamp within struct stat but the field name differs among Linux, BSD, etc. On Linux you can get at this with st_mtim.tv_nsec and on BSD it is st_mtimespec.tv_nsec (this also works for OS X).

With autoconf you can use something like:

AC_CHECK_MEMBERS([struct stat.st_mtimespec.tv_nsec])
AC_CHECK_MEMBERS([struct stat.st_mtim.tv_nsec])

And then later you can pull the nanoseconds out of the timestamp with:

#if defined HAVE_STRUCT_STAT_ST_MTIMESPEC_TV_NSEC
   ns = st.st_mtimespec.tv_nsec;
#elif defined HAVE_STRUCT_STAT_ST_MTIM_TV_NSEC
   ns = st.st_mtim.tv_nsec;
#else
   ns = 0;
#endif

This works the same way for atime and ctime as well as mtime. Make sure to handle the #else case as some systems (Cygwin?) don’t have this at all.